How To Duplicate Sheets in Tableau
Want to learn how to duplicate worksheets in Tableau and save your formatting? In this brief tutorial, we will guide you through the duplication process and functions step by step.
Even if just starting off with data science, you’d know already that Tableau is one of the essential data visualization tools when it comes to data analytics and business intelligence. So if you haven’t done that already, it will be a good idea to and begin your journey through data visualization. For a more thorough and comprehensive introduction to Tableau check our course.
In our last tutorial on how to create a chart in Tableau, we created a visualization showing us the 2016 GDP of each country. Now you will learn how to duplicate sheets in Tableau using the same example and the same data set. This time we’ll add a similar visualization but for ‘2015’ and expressing ‘GDP figures’ as a percentage of a total. Doing so, you will also learn additional important functions in Tableau as:
- Creating a Blank Worksheet in Tableau
- Duplicating a Worksheet in Tableau and Renaming Your Sheets
- Removing a Feature from Duplicated Tableau Sheet
- Adding a New Feature to Tableau Worksheet and Visualizing Percent of Total
Creating a Blank Worksheet in Tableau
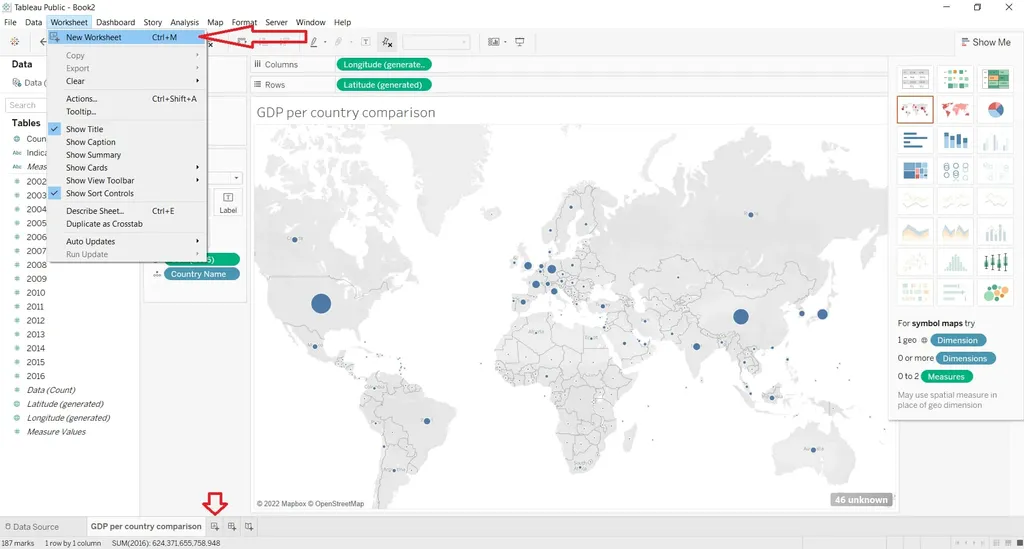
If you just want to start all over and simply create a new worksheet, there are two ways to do so. You can either press the “add new worksheet” button or go to “Worksheet”, select “New worksheet” and create a new blank sheet.
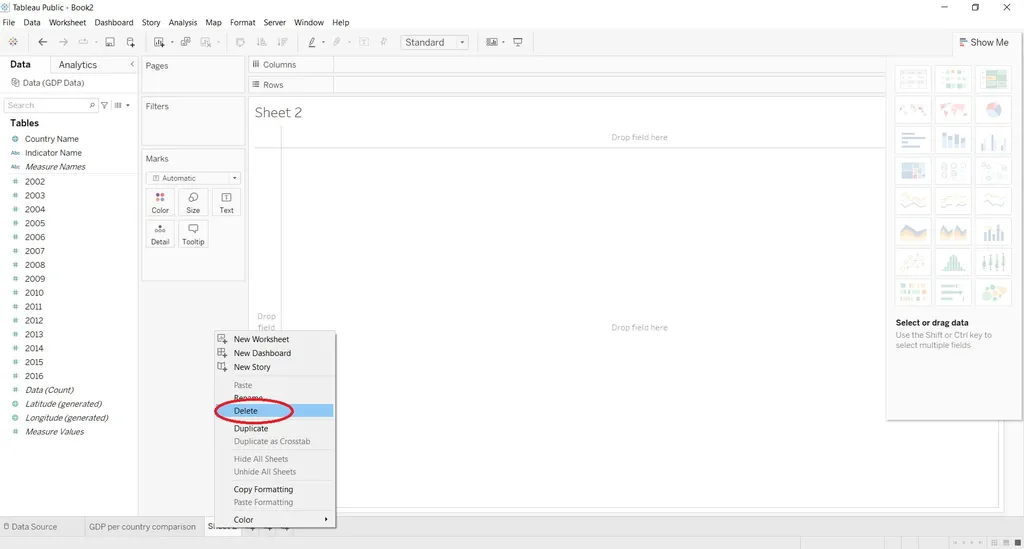
Sometimes, however, this may not be the best possible solution, as we will lose many of the edits we have already made. So, what we’ll do is delete the empty sheet we created by right-clicking and pressing “Delete”. The redundant sheet will be gone, and we can create another duplicate worksheet, preserving the edits.
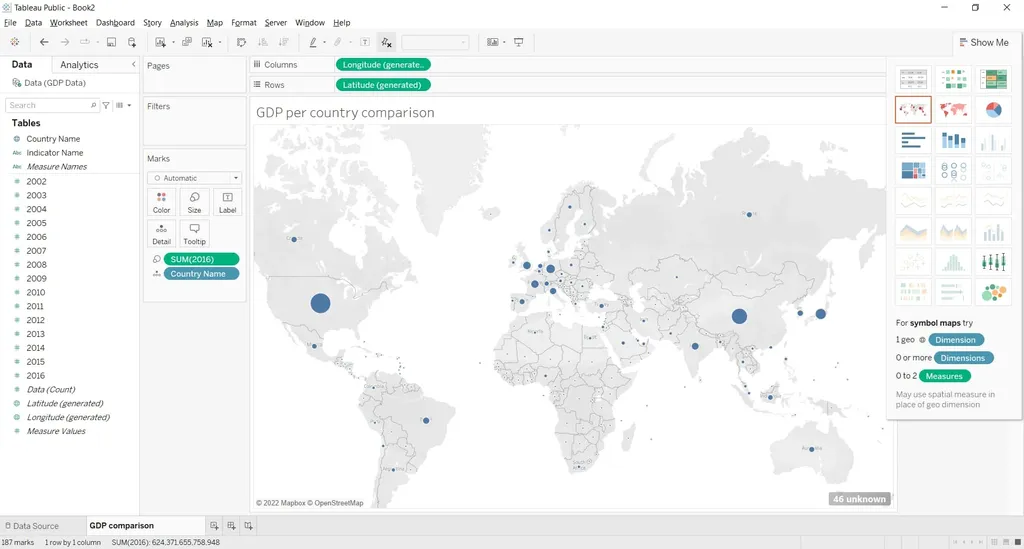
By the way, here is a good place to mention that it is easy to change a sheet’s name. Just double click on it and then type the sheet’s new name - “GDP comparison” in our case.
Duplicating a Worksheet in Tableau and Renaming Your Sheets
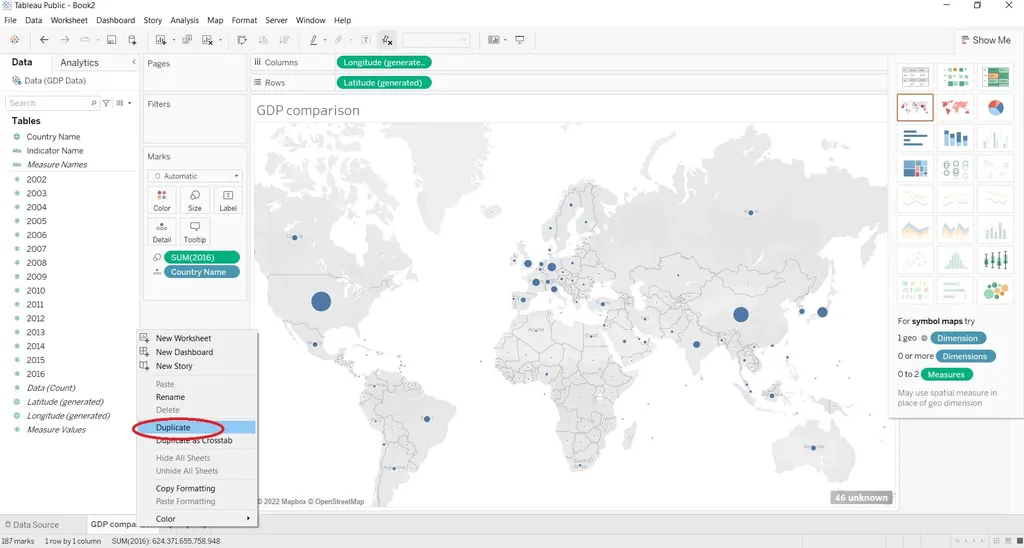
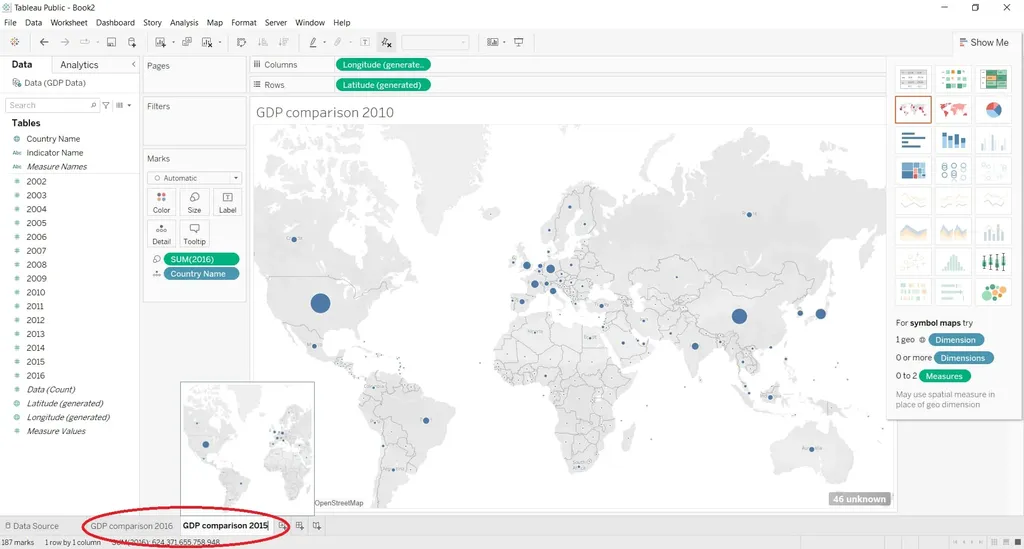
As you have probably noticed so far, the interface is intuitive and easy to grasp. This refers also to creating a duplicated Tableau worksheet. Let's start with the previous visualization we have already created. You can use the “Duplicate” button to create an identical sheet to the one we saw earlier.
Next, you need to change the titles of the two sheets. The first one will be “GDP comparison 2016”, and the second one “GDP Comparison 2015”. You already know how to do that - double click on the sheet name and typing the new one. If you still find it a bit hard to navigate through Tableau’s interface, you can always check our quick tutorial.
While adjusting names, you can change the title of the first visualization accordingly – “GDP Comparison 2016”. And you can do the same for the visualization on the next sheet – “GDP Comparison 2015”.
Removing a Feature from Duplicated Tableau Sheet
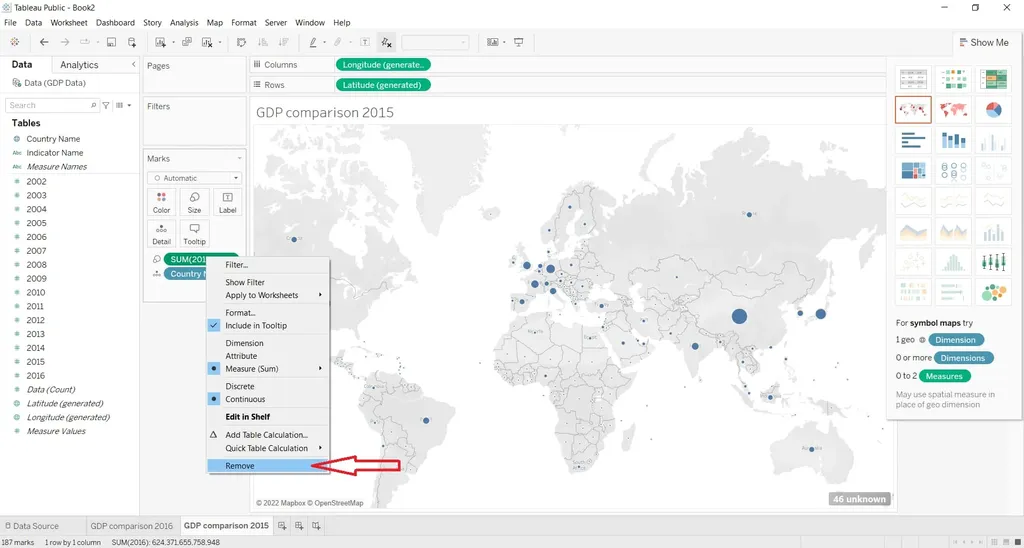
Using our example, let’s delete the 2016 data after we duplicate the sheet in Tableu. To do that, click on the “SUM(2016)” field and press “Remove”. Now all circles have the same size because we removed the differentiating factor – GDP size.
The reason we see “SUM” here is that Tableau needs to run some sort of math operation with the 2016 column of data it found in Excel. It says it sums the data, however, what it really does is find the one field which corresponds to the United States and “sum” all values related to it (there is just one value corresponding to both United States and 2016). For those of you who are familiar with the similarities between Excel and Tableau, you can recognize that Tableau performs an operation like SUMIF in this case.
Adding a New Feature to Tableau Worksheet and Visualizing Percent of Total
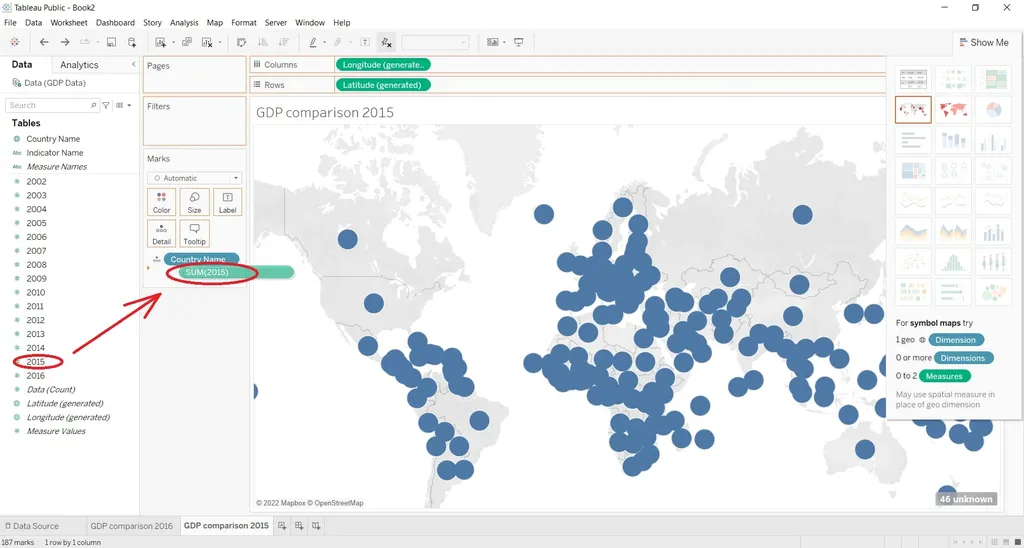
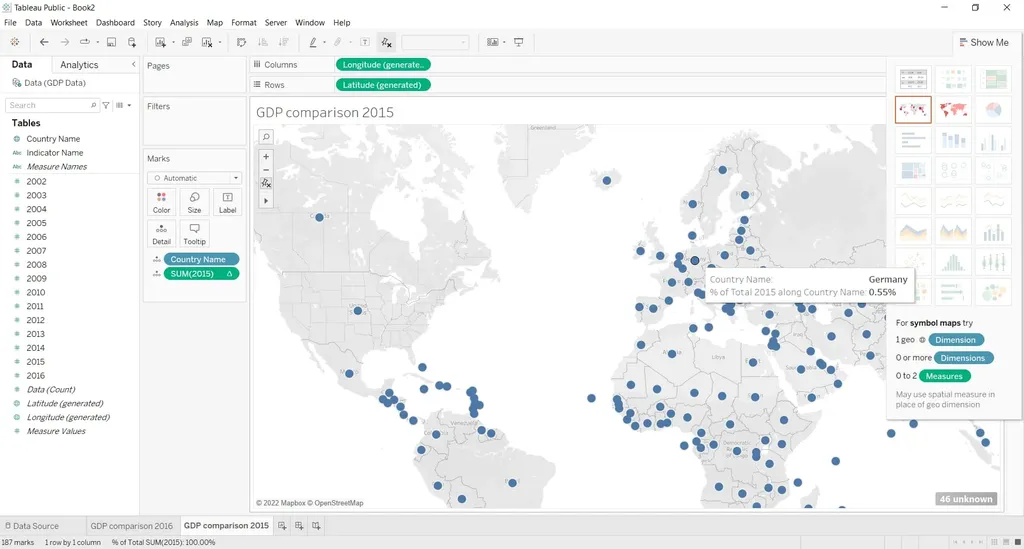
After we have learned how to delete features, now it is time to add the 2015 data. Just drag the “2015” field in the workspace area.
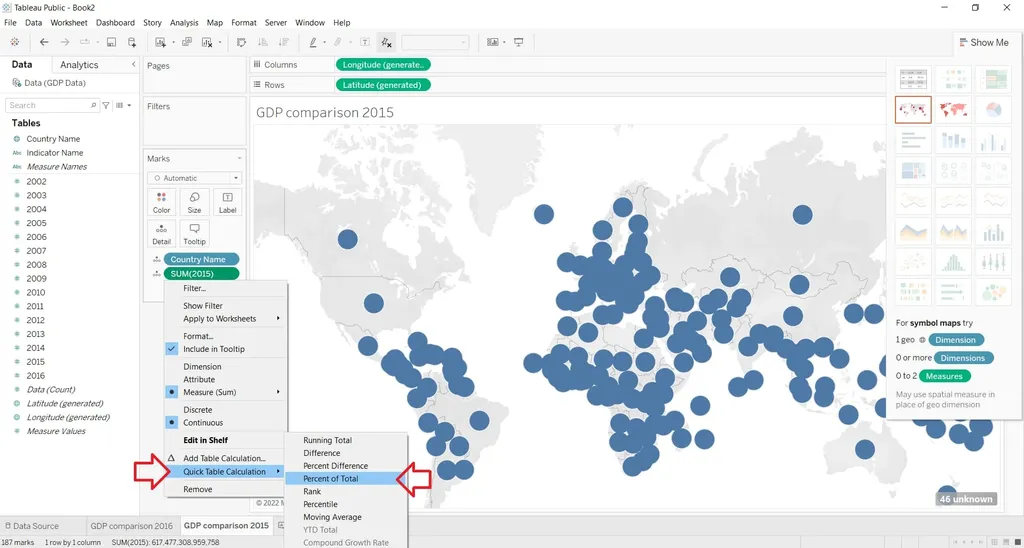
Now, as mentioned in the begining, we would like to display each country’s GDP as a percentage of the total GDP observed in 2015. Click on the tiny arrow next to the 2015 field, go to “Quick table calculation” and select “percent of total”.
If we hover over the bubble of a given country, we’ll be able to see the percentage of the total world economy it accounts for. The United States represented almost 3% of the entire global economy. China produced 1.8% of the global output, and Germany accounted for 0.55%.
Q&A
What is Tableau used for?
Tableau is a data visualization tool primarily directed to business intelligence. Tableau stores and extracts data from cloud databases, spreadsheets, in-memory data engines etc. and transforms this data into graph-type visualizations.
What is the main difference between Tableau and Excel?
As mentioned above, tableau is a visualization tool – it depicts data for you to retrieve insights, specific patterns and trends, and help decision making. On the other hand, Excel is used for calculations, data reporting, and data analysis in spreadsheets through mathematical and logical functions.
Why is it useful to learn Tableau?
Most companies are using data analytics to optimize, predict, and plan future performance. Tableau is a tool which quickly transforms raw data into easily digestible, descriptive and well-designed graphics. Learning to operate with Tableau implies improving your data-driven decision making and performing quicker data analysis.
When you have mastered the essentials related to duplicating worksheets in Tableau, you can move to our next tutorials. There you’ll learn how to create a table with some custom fields and how to add a calculation to a table.
Warm up your fingers and mousepads and continue enjoying our Tableau tutorials! And if you need extra and in-depth knowledge, try our Tableau Training Course.
And if you feel curious and want to learn extra skills the 365 Data Science Program offers self-paced courses led by renowned industry experts. Starting from the very basics all the way to advanced specialization, you will learn by doing with a myriad of practical exercises and real-world business cases. If you want to see how the training works, start with a selection of free lessons by signing up below.





Comments
Post a Comment